Market Outlook
January 09, 2017
Market Cues
Domestic Indices
Chg (%)
(Pts)
(Close)
Indian markets are likely to open flat with a positive bias tracking SGX Nifty.
BSE Sensex
(0.4)
(119)
26,759
U.S. markets closed higher after hitting all-time highs on Friday as the technology
Nifty
(0.4)
(30)
8,244
sector led, while investors parsed through key employment data. U.S.
Mid Cap
(0.3)
(34)
12,322
The European markets ended Friday's session with mixed results, but the majority
Small Cap
(0.4)
(53)
12,440
finished with slight gains. The markets were locked in a narrow trading range
Bankex
0.9
178
20,901
throughout the day and did not stray too far away from the flat line in either
direction.
Global Indices
Chg (%)
(Pts)
(Close)
Indian Market fell slightly on Friday as IT stocks continued to come under selling
Dow Jones
0.3
65
19,964
pressure ahead of quarterly results beginning next week. Profit booking after
Thursday's rally, weakness in the rupee in the evening trade and sluggish cues from
Nasdaq
0.6
33
5,521
European markets also dented investor sentiment.
FTSE
0.2
15
7,210
Nikkei
(0.3)
(66)
19,454
News Analysis
Hang Seng
0.2
46
22,503
RBI imposes `3cr penalty on Lakshmi Vilas Bank
Shanghai Com
(0.4)
(11)
3,154
Detailed analysis on Pg2
Investor’s Ready Reckoner
Advances / Declines
BSE
NSE
Key Domestic & Global Indicators
Advances
1,170
612
Stock Watch: Latest investment recommendations on 150+ stocks
Declines
1,587
1,011
Refer Pg5 onwards
Unchanged
157
64
Top Picks
CMP
Target
Upside
Volumes (` Cr)
Company
Sector
Rating
(`)
(`)
(%)
BSE
3,334
Amara Raja Batteries Auto & Auto Ancillary
Buy
928
1,167
25.7
Alkem Laboratories
Pharmaceuticals
Buy
1,660
1,989
19.8
NSE
18,343
HCL Tech
IT
Buy
814
1,000
22.8
Power Grid Corp.
Power
Buy
189
223
18.1
Net Inflows (` Cr)
Net
Mtd
Ytd
Navkar Corp.
Others
Buy
173
265
52.9
FII
(43)
(1,626)
(1,626)
More Top Picks on Pg3
MFs
365
481
481
Key Upcoming Events
Previous
Consensus
Date
Region
Event Description
Top Gainers
Price (`)
Chg (%)
Reading
Expectations
Jswenergy
65
6.0
Jan 10 China
Consumer Price Index (YoY)
2.20
2.20
Jan 11 UK
Industrial Production (YoY)
(1.10)
0.60
Wockpharma
711
5.6
Jan 12 India
Industrial Production YoY
(1.90)
(2.20)
Natcopharm
624
4.5
Jan 12 US
Initial Jobless claims
235.00
255.00
Fortis
192
3.8
Jan 13 India
Imports YoY%
10.40
--
Cadilahc
379
3.7
More Events on Pg4
Top Losers
Price (`)
Chg (%)
Justdial
376
(4.6)
Mindtree
501
(4.4)
Hcc
42
(3.8)
Techm
470
(3.8)
Hexaware
201
(3.7)
As on January 06, 2017
Market Outlook
January 09, 2017
News Analysis
RBI imposes `3cr penalty on Lakshmi Vilas Bank
The Reserve Bank on Friday said it has imposed a penalty of `3cr on Lakshmi
Vilas. The penalty has been imposed for “contravention of instructions” relating to
opening and operation of current accounts, extending bill discounting facilities to
non-constituents and walk-in customers and non-adherence to KYC norms.
However, The RBI added that the action on the bank is based on deficiencies in
regulatory compliance and “is not intended to pronounce upon the validity of any
transaction or agreement entered into by the bank and its customers. The Reserve
Bank of India had received a complaint regarding irregularities in bill
discounting/purchasing at one of the bank’s branches. RBI carried out an detailed
examination of the irregularities. After conducting detailed examination of
irregularities and considering banks response, the Reserve Bank of India came to
the conclusion that these violations were substantiated and warranted imposition
of monetary penalty.
The penalty is not serious in nature and we have Buy recommendation, with a
target price of `174/- (1.50x FY2018E BV).
Economic and Political News
New H1B visa rules in US: Minimum wage hike may have little impact on firms
double to 18MW this year
India's per capita income to cross `1 lakh in FY17
Delhi cabinet nod to phase-IV of Delhi Metro
Corporate News
Govt clears 26% strategic sale in Bharat Earth Movers
Natco receives US FDA approval for cancer drug bendamustine
Coal India's output target likely to be set at 660 MT for FY18
Market Outlook
January 09, 2017
Top Picks ★★★★★
Large Cap
Market Cap
CMP
Target
Upside
Company
Rationale
(` Cr)
(`)
(`)
(%)
To outpace battery industry growth due to better
Amara Raja Batteries
15,852
928
1,167
25.7
technological products leading to market share gains in both
the automotive OEM and replacement segments.
Strong growth in domestic business due to its leadership in
Alkem Laboratories
19,847
1,660
1,989
19.8
acute therapeutic segment. Alkem expects to launch more
products in USA, which bodes for its international business.
The stock is trading at attractive valuations and is factoring all
HCL Tech
1,14,882
814
1,000
22.8
the bad news.
Back on the growth trend, expect a long term growth of 14%
Infosys
2,23,137
971
1,249
28.5
to be a US$20bn in FY2020.
Strong order backlog and improvement in execution would
Larsen & Toubro
1,29,749
1,391
1,634
17.5
trigger the growth for the L&T
One of the largest pharma companies with strong
Lupin
68,271
1,512
1,809
19.6
international presence. It has a rich pipeline of ANDAs which
is also one of the largest among the generic companies.
Going forward, we expect the company to report strong top-
Power Grid Corporation
98,746
189
223
18.1
line CAGR of ~16% and bottom-line CAGR of ~19% over
FY16-18 on back of strong capitalization guidance
Source: Company, Angel Research
Mid Cap
Market Cap
CMP
Target
Upside
Company
Rationale
(` Cr)
(`)
(`)
(%)
We expect the company would report strong profitability
Asian Granito
710
236
351
48.8
owing to better product mix, higher B2C sales and
amalgamation synergy.
Among the top 4 players in the consumer durables segment.
Bajaj Electricals
2,316
229
274
19.6
Improved profitability backed by turn around in E&P segment.
Strong order book lends earnings visibility.
Favourable outlook for the AC industry to augur well for
Cooling products business which is out pacing the market
Blue Star
4,699
492
634
28.9
growth. EMPPAC division's profitability to improve once
operating environment turns around.
With a focus on the low and medium income (LMI) consumer
Dewan Housing Finance
7,789
249
350
40.7
segment, the company has increased its presence in tier-II &
III cities where the growth opportunity is immense.
Strong loan growth backed by diversified loan portfolio and
Equitas Holdings
4,962
148
235
58.8
adequate CAR. ROE & ROA likely to remain decent as risk of
dilution remains low. Attractive valuations considering growth.
Economic recovery to have favourable impact on advertising
& circulation revenue growth. Further, the acquisition of a
Jagran Prakashan
5,732
175
225
28.3
radio business (Radio City) would also boost the company's
revenue growth.
High order book execution in EPC segment, rising B2C sales
KEI Industries
1,049
135
153
13.4
and higher exports to boost the revenues and profitability
Speedier execution and speedier sales, strong revenue visibilty
Mahindra Lifespace
1,464
357
522
46.4
in short-to-long run, attractive valuations
Higher growth in domestic branded sales and healthy export
Mirza International
1,116
93
107
15.3
to boost the profitability.
Massive capacity expansion along with rail advantage at ICD
Navkar Corporation
2,471
173
265
52.9
as well CFS augurs well for the company
Strong brands and distribution network would boost growth
Siyaram Silk Mills
1,288
1,374
1,605
16.8
going ahead. Stock currently trades at an inexpensive
valuation.
Market leadership in Hindi news genre and no. 2 viewership
ranking in English news genre, exit from the radio business,
TV Today Network
1,645
276
385
39.6
and anticipated growth in ad spends by corporates to benefit
the stock.
Source: Company, Angel Research
Market Outlook
January 09, 2017
Key Upcoming Events
Global economic events release calendar
Bloomberg Data
Date
Time
Country
Event Description
Unit
Period
Last Reported
Estimated
Jan 10, 2017
7:00 AM
China
Consumer Price Index (YoY)
% Change
Dec
2.20
2.20
Jan 11, 2017
3:00 PM
UK
Industrial Production (YoY)
% Change Nov
(1.10)
0.60
Jan 12, 2017
5:30 PM
India
Industrial Production YoY
% Change Nov
(1.90)
(2.20)
7:00 PM
US
Initial Jobless claims
Thousands Jan 7
235.00
255.00
Jan 13, 2017
India
Imports YoY%
% Change
Dec
10.40
US
Producer Price Index (mom)
% Change
Dec
-
India
Exports YoY%
% Change
Dec
2.30
China
Exports YoY%
% Change
Dec
(1.60)
(3.80)
Jan 16, 2017
12:00 PM
India Monthly Wholesale Prices YoY%
% Change
Dec
3.15
Jan 17, 2017
3:00 PM
UK
CPI (YoY)
% Change
Dec
1.20
Jan 18, 2017
7:00 PM
US Consumer price index (mom)
% Change
Dec
0.20
0.30
3:30 PM Euro Zone
Euro-Zone CPI (YoY)
% Dec F
1.10
3:00 PM
UK
Jobless claims change
% Change
Dec
2.40
7:45 PM
US
Industrial Production
% Dec
(0.44)
0.35
Jan 19, 2017
7:00 PM
US
Housing Starts
Thousands
Dec
1,090.00
1,170.00
7:00 PM
US
Building permits
Thousands
Dec
1,212.00
1,220.00
6:15 PM Euro Zone
ECB announces interest rates
%
Jan 19
-
Jan 20, 2017
7:30 AM
China
Real GDP (YoY)
% Change
4Q
6.70
7:30 AM
China
Industrial Production (YoY)
% Change
Dec
6.20
Jan 23, 2017
8:30 PM Euro ZoneEuro-Zone Consumer Confidence
Value Jan A
(5.10)
Jan 24, 2017
2:00 PM
Germany
PMI Services
Value Jan P
54.30
8:30 PM
US
Existing home sales
Million
Dec
5.61
2:00 PM
Germany
PMI Manufacturing
Value Jan P
55.60
Jan 26, 2017
3:00 PM
UK
GDP (YoY)
% Change 4Q A
2.20
8:30 PM
US
New home sales
Thousands
Dec
592.00
Source: Bloomberg, Angel Research
Market Outlook
January 09, 2017
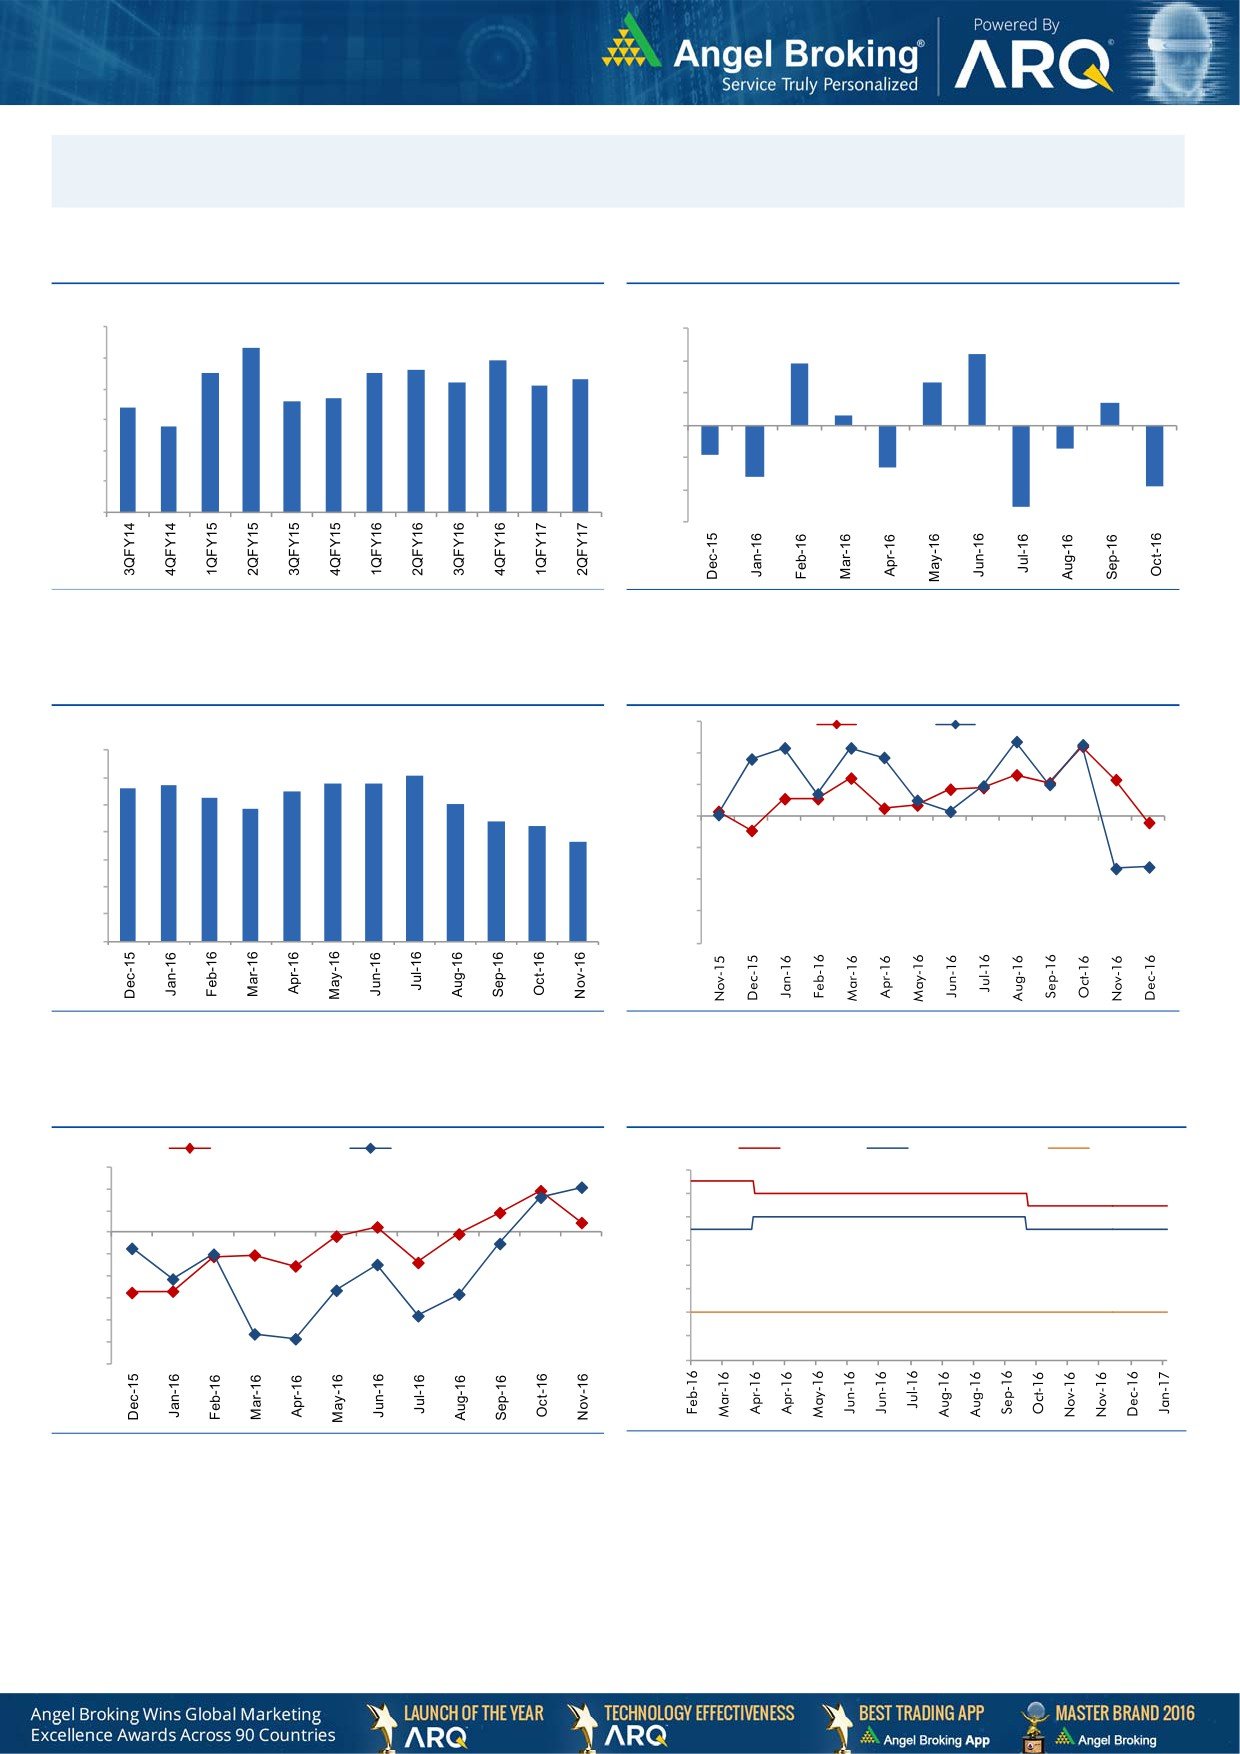
Macro watch
Exhibit 1: Quarterly GDP trends
Exhibit 2: IIP trends
(%)
(%)
9.0
8.3
3.0
2.2
7.9
1.9
7.5
7.5
7.6
8.0
7.3
2.0
7.2
7.1
1.3
6.6
6.7
0.7
7.0
6.4
1.0
0.3
5.8
6.0
-
5.0
(1.0)
(0.7)
(0.9)
4.0
(1.3)
(2.0)
(1.6)
(1.9)
3.0
(3.0)
(2.5)
Source: CSO, Angel Research
Source: MOSPI, Angel Research
Exhibit 3: Monthly CPI inflation trends
Exhibit 4: Manufacturing and services PMI
56.0
Mfg. PMI
Services PMI
(%)
7.0
54.0
6.1
5.6
5.7
5.8
5.8
6.0
5.3
5.5
5.1
52.0
4.8
5.0
4.4
4.2
50.0
3.6
4.0
48.0
3.0
46.0
2.0
1.0
44.0
-
42.0
Source: MOSPI, Angel Research
Source: Market, Angel Research; Note: Level above 50 indicates expansion
Exhibit 5: Exports and imports growth trends
Exhibit 6: Key policy rates
(%)
Exports yoy growth
Imports yoy growth
(%)
Repo rate
Reverse Repo rate
CRR
15.0
7.00
10.0
6.50
5.0
6.00
0.0
5.50
(5.0)
5.00
(10.0)
4.50
(15.0)
4.00
(20.0)
3.50
(25.0)
(30.0)
3.00
Source: Bloomberg, Angel Research
Source: RBI, Angel Research
Market Outlook
January 09, 2017
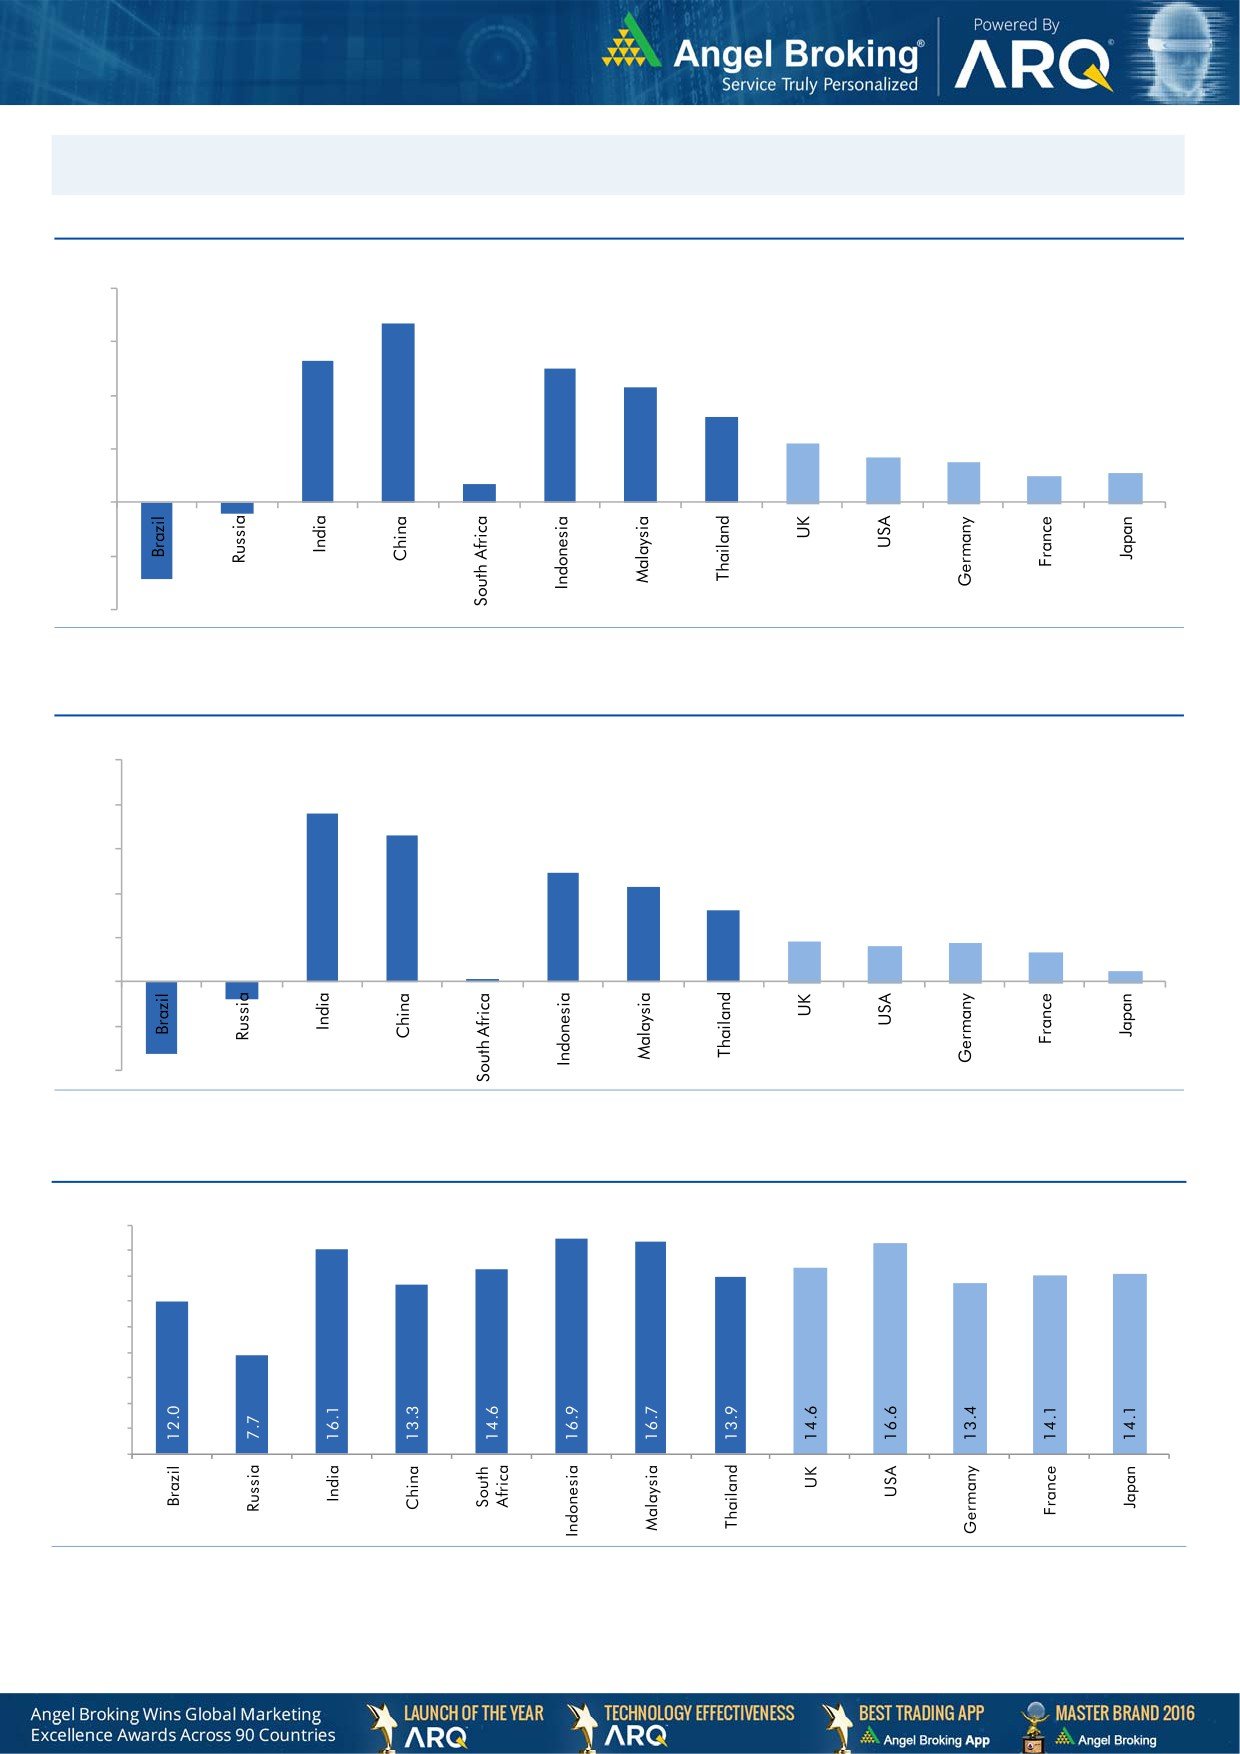
Global watch
Exhibit 1: Latest quarterly GDP Growth (%, yoy) across select developing and developed countries
(%)
8.0
6.7
5.3
6.0
5.0
0.7
4.3
4.0
3.2
2.2
1.7
1.5
2.0
1.0
1.1
-
(2.0)
(0.4)
(2.9)
(4.0)
Source: Bloomberg, Angel Research
Exhibit 2: 2016 GDP Growth projection by IMF (%, yoy) across select developing and developed countries
(%)
10.0
7.6
8.0
6.6
6.0
4.9
4.3
4.0
3.2
1.8
1.7
1.6
2.0
1.3
(0.8)
0.5
(3.3)
0.1
-
(2.0)
(4.0)
Source: IMF, Angel Research
Exhibit 3: One year forward P-E ratio across select developing and developed countries
(x)
18.0
16.0
14.0
12.0
10.0
8.0
6.0
4.0
2.0
-
Source: IMF, Angel Research
Market Outlook
January 09, 2017
Exhibit 4: Relative performance of indices across globe
Returns (%)
Country
Name of index
Closing price
1M
3M
1YR
Brazil
Bovespa
61,665
0.9
3.9
47.6
Russia
Micex
2,214
2.9
11.6
31.6
India
Nifty
8,244
1.7
(5.7)
3.5
China
Shanghai Composite
3,154
(1.4)
5.0
(10.7)
South Africa
Top 40
44,456
2.4
(2.2)
(0.5)
Mexico
Mexbol
46,072
2.1
(4.3)
13.2
Indonesia
LQ45
900
2.2
(3.8)
14.2
Malaysia
KLCI
1,675
2.9
0.8
(1.0)
Thailand
SET 50
984
3.9
3.5
20.5
USA
Dow Jones
19,964
3.9
9.2
22.1
UK
FTSE
7,210
7.1
2.5
22.8
Japan
Nikkei
19,454
5.6
18.3
3.7
Germany
DAX
11,599
7.6
10.6
18.4
France
CAC
4,910
6.0
10.3
17.2
Source: Bloomberg, Angel Research
Stock Watch
January 09, 2017
Company Name
Reco
CMP
Target
Mkt Cap
Sales ( Čcr )
OPM(%)
EPS (Č)
PER(x)
P/BV(x)
RoE(%)
EV/Sales(x)
(Č)
Price ( Č)
( Č cr )
FY17E FY18E
FY17E
FY18E
FY17E
FY18E
FY17E
FY18E
FY17E
FY18E
FY17E
FY18E
FY17E
FY18E
Agri / Agri Chemical
Rallis
Neutral
204
-
3,971
1,937
2,164
13.3
14.3
9.0
11.0
22.7
18.6
4.0
3.5
18.4
19.8
2.1
1.8
United Phosphorus
Neutral
660
-
33,436
15,176
17,604
18.5
18.5
37.4
44.6
17.6
14.8
3.5
2.9
21.4
21.2
2.3
1.9
Auto & Auto Ancillary
Ashok Leyland
Buy
85
111
24,261
22,407
26,022
10.6
10.6
5.2
6.4
16.3
13.3
3.7
3.1
23.6
24.7
1.2
1.0
Bajaj Auto
Neutral
2,708
-
78,372
25,093
27,891
19.5
19.2
143.9
162.5
18.8
16.7
5.3
4.5
30.3
29.4
2.9
2.5
Bharat Forge
Neutral
912
-
21,223
7,726
8,713
20.5
21.2
35.3
42.7
25.8
21.4
4.8
4.3
18.9
20.1
2.8
2.4
Eicher Motors
Neutral
22,718
-
61,800
16,583
20,447
17.5
18.0
598.0
745.2
38.0
30.5
13.0
9.9
41.2
38.3
3.6
2.8
Gabriel India
Buy
108
130
1,548
1,544
1,715
9.0
9.3
5.4
6.3
20.0
17.1
3.8
3.3
18.9
19.5
1.0
0.8
Hero Motocorp
Buy
3,069
3,541
61,277
30,958
34,139
15.7
15.7
193.6
208.3
15.9
14.7
6.2
5.1
34.2
30.5
1.8
1.6
Jamna Auto Industries Neutral
184
-
1,462
1,486
1,620
9.8
9.9
15.0
17.2
12.2
10.7
2.7
2.3
21.8
21.3
1.1
1.0
L G Balakrishnan & Bros Neutral
592
-
929
1,302
1,432
11.6
11.9
43.7
53.0
13.6
11.2
1.9
1.7
13.8
14.2
0.8
0.7
Mahindra and Mahindra Neutral
1,220
-
75,786
46,534
53,077
11.6
11.7
67.3
78.1
18.1
15.6
3.0
2.6
15.4
15.8
1.6
1.4
Maruti
Accumulate
5,613
6,006
169,561
68,057
82,958
15.8
15.5
212.1
261.2
26.5
21.5
5.2
4.4
19.8
20.3
2.2
1.7
Minda Industries
Neutral
327
-
2,594
2,728
3,042
9.0
9.1
68.2
86.2
4.8
3.8
1.1
0.9
23.8
24.3
1.0
0.9
Motherson Sumi
Neutral
332
-
46,537
45,896
53,687
7.8
8.3
13.0
16.1
25.4
20.6
8.2
6.5
34.7
35.4
1.1
0.9
Rane Brake Lining
Neutral
995
-
788
511
562
11.3
11.5
28.1
30.9
35.4
32.2
5.4
4.9
15.3
15.0
1.7
1.5
Setco Automotive
Neutral
37
-
493
741
837
13.0
13.0
15.2
17.0
2.4
2.2
0.4
0.4
15.8
16.3
1.1
1.0
Tata Motors
Neutral
498
-
143,725
300,209
338,549
8.9
8.4
42.7
54.3
11.7
9.2
1.9
1.6
15.6
17.2
0.6
0.5
TVS Motor
Neutral
385
-
18,310
13,390
15,948
6.9
7.1
12.8
16.5
30.2
23.3
7.5
6.0
26.3
27.2
1.4
1.2
Amara Raja Batteries
Buy
928
1,167
15,852
5,504
6,605
17.6
17.5
33.4
40.9
27.8
22.7
6.1
5.0
22.1
22.0
2.9
2.4
Exide Industries
Neutral
186
-
15,844
7,439
8,307
15.0
15.0
8.1
9.3
23.0
20.0
3.2
2.9
14.3
16.7
1.7
1.6
Apollo Tyres
Buy
189
235
9,605
12,877
14,504
14.3
13.9
21.4
23.0
8.8
8.2
1.4
1.2
16.4
15.2
0.9
0.8
Ceat
Buy
1,197
1,450
4,842
7,524
8,624
13.0
12.7
131.1
144.3
9.1
8.3
1.7
1.4
19.8
18.6
0.7
0.6
JK Tyres
Neutral
117
-
2,648
7,455
8,056
15.0
15.0
21.8
24.5
5.4
4.8
1.1
0.9
22.8
21.3
0.5
0.4
Swaraj Engines
Neutral
1,345
-
1,671
660
810
15.2
16.4
54.5
72.8
24.7
18.5
7.7
7.0
31.5
39.2
2.4
1.9
Subros
Neutral
166
-
999
1,488
1,681
11.7
11.9
6.4
7.2
26.0
23.2
2.8
2.5
10.8
11.4
0.9
0.8
Indag Rubber
Neutral
184
-
482
286
326
19.8
16.8
11.7
13.3
15.7
13.8
2.7
2.5
17.8
17.1
1.4
1.2
Capital Goods
ACE
Neutral
49
-
489
709
814
4.1
4.6
1.4
2.1
35.3
23.5
1.5
1.4
4.4
6.0
0.9
0.7
BEML
Neutral
993
-
4,137
3,451
4,055
6.3
9.2
31.4
57.9
31.6
17.2
1.9
1.7
6.3
10.9
1.3
1.1
Bharat Electronics
Neutral
1,412
-
31,531
8,137
9,169
16.8
17.2
58.7
62.5
24.1
22.6
3.7
3.3
44.6
46.3
2.9
2.6
Stock Watch
January 09, 2017
Company Name
Reco
CMP
Target
Mkt Cap
Sales ( Čcr )
OPM(%)
EPS (Č)
PER(x)
P/BV(x)
RoE(%)
EV/Sales(x)
(Č)
Price ( Č)
( Č cr )
FY17E
FY18E
FY17E
FY18E
FY17E
FY18E
FY17E
FY18E
FY17E
FY18E
FY17E
FY18E
FY17E
FY18E
Capital Goods
Voltas
Buy
336
407
11,124
6,511
7,514
7.9
8.7
12.9
16.3
26.1
20.6
4.7
4.1
16.7
18.5
1.5
1.2
BGR Energy
Neutral
123
-
885
16,567
33,848
6.0
5.6
7.8
5.9
15.7
20.8
0.9
0.9
4.7
4.2
0.2
0.1
BHEL
Neutral
126
-
30,938
28,797
34,742
-
2.8
2.3
6.9
55.0
18.3
0.9
0.9
1.3
4.8
0.7
0.5
Blue Star
Buy
492
634
4,699
4,283
5,077
5.9
7.3
14.9
22.1
33.0
22.2
6.4
5.4
20.4
26.4
1.1
1.0
Crompton Greaves
Neutral
62
-
3,876
5,777
6,120
5.9
7.0
3.3
4.5
18.7
13.7
0.8
0.8
4.4
5.9
0.6
0.5
Greaves Cotton
Neutral
123
-
2,992
1,755
1,881
16.8
16.9
7.8
8.5
15.7
14.4
3.1
2.9
20.6
20.9
1.4
1.3
Inox Wind
Neutral
183
-
4,068
5,605
6,267
15.7
16.4
24.8
30.0
7.4
6.1
2.1
1.5
25.9
24.4
0.8
0.6
KEC International
Neutral
144
-
3,710
9,294
10,186
7.9
8.1
9.9
11.9
14.6
12.1
2.1
1.9
15.6
16.3
0.6
0.6
KEI Industries
Accumulate
135
153
1,049
2,574
2,921
10.4
10.0
10.1
11.8
13.4
11.4
2.4
2.0
17.7
17.4
0.6
0.5
Thermax
Neutral
802
-
9,553
5,421
5,940
7.3
7.3
25.7
30.2
31.2
26.6
3.8
3.5
12.2
13.1
1.6
1.5
VATech Wabag
Buy
480
681
2,618
3,136
3,845
8.9
9.1
26.0
35.9
18.5
13.4
2.3
2.0
13.4
15.9
0.7
0.6
Cement
ACC
Neutral
1,335
-
25,073
11,225
13,172
13.2
16.9
44.5
75.5
30.0
17.7
2.8
2.6
11.2
14.2
2.2
1.9
Ambuja Cements
Neutral
213
-
42,225
9,350
10,979
18.2
22.5
5.8
9.5
36.7
22.4
3.1
2.8
10.2
12.5
4.5
3.9
India Cements
Neutral
125
-
3,852
4,364
4,997
18.5
19.2
7.9
11.3
15.9
11.1
1.1
1.1
8.0
8.5
1.6
1.4
JK Cement
Neutral
715
-
4,996
4,398
5,173
15.5
17.5
31.2
55.5
22.9
12.9
2.8
2.4
12.0
15.5
1.7
1.4
J K Lakshmi Cement
Buy
357
565
4,199
2,913
3,412
14.5
19.5
7.5
22.5
47.6
15.9
2.9
2.5
12.5
18.0
2.0
1.7
Orient Cement
Buy
127
215
2,602
2,114
2,558
18.5
20.5
8.1
11.3
15.7
11.2
2.3
2.0
9.0
14.0
1.9
1.4
UltraTech Cement
Neutral
3,331
-
91,412
25,768
30,385
21.0
23.5
111.0
160.0
30.0
20.8
3.8
3.4
13.5
15.8
3.6
3.0
Construction
ITNL
Neutral
112
-
3,676
8,946
10,017
31.0
31.6
8.1
9.1
13.8
12.3
0.5
0.5
4.2
5.0
3.7
3.5
KNR Constructions
Neutral
168
-
2,358
1,385
1,673
14.7
14.0
41.2
48.5
4.1
3.5
0.8
0.7
14.9
15.2
1.8
1.5
Larsen & Toubro
Buy
1,391
1,634
129,749
111,017
124,908
11.0
11.0
61.1
66.7
22.8
20.9
2.7
2.5
13.1
12.9
2.2
2.0
Gujarat Pipavav Port
Neutral
135
-
6,507
705
788
52.2
51.7
5.0
5.6
26.9
24.0
2.7
2.4
11.2
11.2
8.9
7.5
Nagarjuna Const.
Neutral
83
-
4,623
8,842
9,775
9.1
8.8
5.3
6.4
15.7
13.0
1.2
1.1
8.2
9.1
0.7
0.6
PNC Infratech
Buy
105
143
2,685
2,350
2,904
13.1
13.2
9.0
8.8
11.6
11.9
0.4
0.4
15.9
13.9
1.3
1.0
Simplex Infra
Neutral
285
-
1,407
6,829
7,954
10.5
10.5
31.4
37.4
9.1
7.6
0.9
0.9
9.9
13.4
0.6
0.5
Power Mech Projects
Neutral
435
-
639
1,801
2,219
12.7
14.6
72.1
113.9
6.0
3.8
1.1
0.9
16.8
11.9
0.4
0.3
Sadbhav Engineering
Accumulate
273
298
4,690
3,598
4,140
10.3
10.6
9.0
11.9
30.4
23.0
3.2
2.8
9.9
11.9
1.6
1.4
NBCC
Neutral
251
-
15,057
7,428
9,549
7.9
8.6
8.2
11.0
30.6
22.8
1.5
1.2
28.2
28.7
1.7
1.3
MEP Infra
Neutral
39
-
635
1,877
1,943
30.6
29.8
3.0
4.2
13.0
9.3
6.3
4.2
0.6
0.6
1.7
1.6
Stock Watch
January 09, 2017
Company Name
Reco
CMP
Target
Mkt Cap
Sales ( Čcr )
OPM(%)
EPS (Č)
PER(x)
P/BV(x)
RoE(%)
EV/Sales(x)
(Č)
Price ( Č)
( Č cr )
FY17E
FY18E
FY17E
FY18E
FY17E
FY18E
FY17E
FY18E
FY17E
FY18E
FY17E
FY18E
FY17E
FY18E
Construction
SIPL
Neutral
97
-
3,399
1,036
1,252
65.5
66.2
(8.4)
(5.6)
3.6
4.1
(22.8)
(15.9)
11.5
9.6
Engineers India
Neutral
153
-
10,307
1,725
1,935
16.0
19.1
11.4
13.9
13.4
11.0
1.9
1.8
13.4
15.3
4.9
4.4
Financials
Axis Bank
Buy
455
630
108,780
46,932
53,575
3.5
3.4
32.4
44.6
14.1
10.2
1.8
1.6
13.6
16.5
-
-
Bank of Baroda
Neutral
153
-
35,277
19,980
23,178
1.8
1.8
11.5
17.3
13.3
8.9
1.5
1.3
8.3
10.1
-
-
Canara Bank
Neutral
271
-
14,693
15,225
16,836
1.8
1.8
14.5
28.0
18.7
9.7
1.3
1.0
5.8
8.5
-
-
Dewan Housing Finance Buy
249
350
7,789
2,225
2,688
2.9
2.9
29.7
34.6
8.4
7.2
1.4
1.2
16.1
16.8
-
-
Equitas Holdings
Buy
148
235
4,962
939
1,281
11.7
11.5
5.8
8.2
25.5
18.0
2.2
2.0
10.9
11.5
-
-
Federal Bank
Buy
67
85
11,588
8,259
8,995
3.0
3.0
4.3
5.6
15.7
12.0
1.3
1.2
8.5
10.1
-
-
HDFC
Neutral
1,222
-
193,699
11,475
13,450
3.4
3.4
45.3
52.5
27.0
23.3
5.2
4.6
20.2
20.5
-
-
HDFC Bank
Accumulate
1,193
1,350
304,624
46,097
55,433
4.5
4.5
58.4
68.0
20.4
17.6
3.6
3.0
18.8
18.6
-
-
ICICI Bank
Buy
258
315
150,256
42,800
44,686
3.1
3.3
18.0
21.9
14.3
11.8
1.9
1.8
11.1
12.3
-
-
Lakshmi Vilas Bank
Buy
137
174
2,614
3,339
3,799
2.7
2.8
11.0
14.0
12.4
9.8
1.3
1.2
11.2
12.7
-
-
LIC Housing Finance
Buy
525
630
26,475
3,712
4,293
2.6
2.5
39.0
46.0
13.5
11.4
2.5
2.2
19.9
20.1
-
-
Punjab Natl.Bank
Neutral
119
-
25,355
23,532
23,595
2.3
2.4
6.8
12.6
17.5
9.5
2.7
1.9
3.3
6.5
-
-
RBL Bank
Neutral
357
-
13,184
1,783
2,309
2.6
2.6
12.7
16.4
28.1
21.7
3.1
2.7
12.8
13.3
-
-
South Ind.Bank
Neutral
21
-
2,785
6,435
7,578
2.5
2.5
2.7
3.1
7.6
6.7
1.0
0.8
10.1
11.2
-
-
St Bk of India
Neutral
246
-
190,926
88,650
98,335
2.6
2.6
13.5
18.8
18.2
13.1
1.7
1.5
7.0
8.5
-
-
Union Bank
Neutral
129
-
8,885
13,450
14,925
2.3
2.3
25.5
34.5
5.1
3.8
0.7
0.6
7.5
10.2
-
-
Yes Bank
Neutral
1,247
-
52,748
8,978
11,281
3.3
3.4
74.0
90.0
16.9
13.9
3.2
2.7
17.0
17.2
-
-
FMCG
Asian Paints
Neutral
928
-
88,985
17,128
18,978
16.8
16.4
19.1
20.7
48.6
44.8
16.9
15.9
34.8
35.5
5.1
4.6
Britannia
Buy
2,889
3,626
34,663
9,594
11,011
14.6
14.9
80.3
94.0
36.0
30.7
14.8
11.4
41.2
-
3.5
3.0
Colgate
Accumulate
900
995
24,469
4,605
5,149
23.4
23.4
23.8
26.9
37.8
33.4
20.9
16.4
64.8
66.8
5.2
4.7
Dabur India
Accumulate
277
304
48,706
8,315
9,405
19.8
20.7
8.1
9.2
34.1
30.1
9.5
7.9
31.6
31.0
5.5
4.8
GlaxoSmith Con*
Neutral
5,118
-
21,524
4,350
4,823
21.2
21.4
179.2
196.5
28.6
26.1
7.6
6.4
27.1
26.8
4.3
3.8
Godrej Consumer
Neutral
1,522
-
51,846
10,235
11,428
18.4
18.6
41.1
44.2
37.0
34.4
8.2
6.9
24.9
24.8
5.1
4.5
HUL
Neutral
833
-
180,219
35,252
38,495
17.8
17.8
20.7
22.4
40.3
37.2
38.5
33.1
95.6
88.9
5.0
4.5
ITC
Buy
243
284
294,125
40,059
44,439
38.3
39.2
9.0
10.1
27.0
23.9
7.5
6.6
27.8
27.5
6.8
6.2
Marico
Buy
260
300
33,579
6,430
7,349
18.8
19.5
6.4
7.7
40.7
33.8
12.3
10.3
33.2
32.5
5.0
4.4
Nestle*
Neutral
5,905
-
56,935
10,073
11,807
20.7
21.5
124.8
154.2
47.3
38.3
19.4
17.5
34.8
36.7
5.5
4.6
Stock Watch
January 09, 2017
Company Name
Reco
CMP
Target
Mkt Cap
Sales ( Čcr )
OPM(%)
EPS (Č)
PER(x)
P/BV(x)
RoE(%)
EV/Sales(x)
(Č)
Price ( Č)
( Č cr )
FY17E FY18E
FY17E
FY18E
FY17E
FY18E
FY17E
FY18E
FY17E
FY18E
FY17E
FY18E
FY17E
FY18E
FMCG
Tata Global
Neutral
125
-
7,867
8,675
9,088
9.8
9.8
7.4
8.2
16.8
15.2
1.9
1.8
7.9
8.1
0.8
0.8
Procter & Gamble
Accumulate
6,861
7,369
22,273
2,939
3,342
23.2
23.0
146.2
163.7
46.9
41.9
105.1
100.8
25.3
23.5
7.1
6.2
Hygiene
IT
HCL Tech^
Buy
814
1,000
114,882
49,242
57,168
20.5
20.5
55.7
64.1
14.6
12.7
3.0
2.3
20.3
17.9
2.2
1.8
Infosys
Buy
971
1,249
223,137
68,350
77,326
27.0
27.0
62.5
69.4
15.5
14.0
3.3
3.0
21.3
21.6
2.7
2.3
TCS
Accumulate
2,284
2,620
449,967
119,025
133,308
27.6
27.6
131.2
145.5
17.4
15.7
5.6
5.2
32.4
33.1
3.6
3.1
Tech Mahindra
Buy
470
600
45,713
29,673
32,937
15.5
17.0
32.8
39.9
14.3
11.8
2.8
2.4
19.6
20.7
1.3
1.1
Wipro
Buy
470
590
114,227
55,440
60,430
18.1
18.1
35.9
39.9
13.1
11.8
2.3
2.2
19.0
19.3
1.8
1.6
Media
D B Corp
Neutral
372
-
6,838
2,297
2,590
27.4
28.2
21.0
23.4
17.7
15.9
4.1
3.6
23.7
23.1
2.8
2.4
HT Media
Neutral
75
-
1,755
2,693
2,991
12.6
12.9
7.9
9.0
9.5
8.4
0.8
0.8
7.8
8.3
0.2
0.1
Jagran Prakashan
Buy
175
225
5,732
2,355
2,635
28.0
28.0
10.8
12.5
16.2
14.0
3.5
3.0
21.7
21.7
2.5
2.1
Sun TV Network
Neutral
533
-
21,003
2,850
3,265
70.1
71.0
26.2
30.4
20.3
17.5
5.2
4.6
24.3
25.6
7.0
5.9
Hindustan Media
Neutral
273
-
2,007
1,016
1,138
24.3
25.2
27.3
30.1
10.0
9.1
1.9
1.7
16.2
15.8
1.3
1.1
Ventures
TV Today Network
Buy
276
385
1,645
637
743
27.5
27.5
18.4
21.4
15.0
12.9
2.6
2.2
17.4
17.2
2.2
1.8
Metals & Mining
Coal India
Neutral
306
-
189,792
84,638
94,297
21.4
22.3
24.5
27.1
12.5
11.3
5.2
5.0
42.6
46.0
1.8
1.6
Hind. Zinc
Neutral
264
-
111,696
14,252
18,465
55.9
48.3
15.8
21.5
16.7
12.3
2.7
2.4
17.0
20.7
7.8
6.1
Hindalco
Neutral
161
-
33,234
107,899
112,095
7.4
8.2
9.2
13.0
17.5
12.4
0.8
0.8
4.8
6.6
0.8
0.8
JSW Steel
Neutral
175
-
42,362
53,201
58,779
16.1
16.2
130.6
153.7
1.3
1.1
0.2
0.2
14.0
14.4
1.6
1.4
NMDC
Neutral
136
-
43,029
6,643
7,284
44.4
47.7
7.1
7.7
19.2
17.7
1.7
1.6
8.8
9.2
4.2
3.8
SAIL
Neutral
52
-
21,435
47,528
53,738
(0.7)
2.1
(1.9)
2.6
20.0
0.6
0.5
(1.6)
3.9
1.3
1.2
Vedanta
Neutral
231
-
68,366
71,744
81,944
19.2
21.7
13.4
20.1
17.2
11.5
1.5
1.3
8.4
11.3
1.3
1.0
Tata Steel
Neutral
420
-
40,762
121,374
121,856
7.2
8.4
18.6
34.3
22.6
12.2
1.4
1.3
6.1
10.1
1.0
1.0
Oil & Gas
Cairn India
Neutral
256
-
47,975
9,127
10,632
4.3
20.6
8.8
11.7
29.1
21.9
0.9
0.9
3.3
4.2
6.7
5.6
GAIL
Neutral
443
-
56,130
56,220
65,198
9.3
10.1
27.1
33.3
16.3
13.3
1.5
1.4
9.3
10.7
1.2
1.0
ONGC
Neutral
202
-
259,809
137,222
152,563
15.0
21.8
19.5
24.1
10.4
8.4
0.9
0.8
8.5
10.1
2.2
1.9
Indian Oil Corp
Neutral
346
-
168,184
373,359
428,656
5.9
5.5
54.0
59.3
6.4
5.8
1.0
0.9
16.0
15.6
0.6
0.5
Reliance Industries
Neutral
1,073
-
347,940
301,963
358,039
12.1
12.6
87.7
101.7
12.2
10.6
1.3
1.1
10.7
11.3
1.6
1.4
Pharmaceuticals
Alembic Pharma
Neutral
606
-
11,433
3,483
4,083
20.2
21.4
24.3
30.4
25.0
20.0
5.7
4.5
25.5
25.3
3.2
2.7
Alkem Laboratories Ltd
Buy
1,660
1,989
19,847
6,043
6,893
18.7
19.3
80.5
88.8
20.6
18.7
4.6
3.8
22.3
20.3
3.2
2.8
Aurobindo Pharma
Buy
693
877
40,538
15,720
18,078
23.7
23.7
41.4
47.3
16.7
14.7
4.4
3.4
29.6
26.1
2.8
2.4
Stock Watch
January 09, 2017
Company Name
Reco
CMP
Target
Mkt Cap
Sales ( Čcr )
OPM(%)
EPS (Č)
PER(x)
P/BV(x)
RoE(%)
EV/Sales(x)
(Č)
Price ( Č)
( Č cr )
FY17E FY18E
FY17E
FY18E
FY17E
FY18E
FY17E
FY18E
FY17E
FY18E
FY17E
FY18E
FY17E
FY18E
Pharmaceuticals
Aventis*
Neutral
4,225
-
9,730
2,277
2,597
17.3
18.3
149.4
172.0
28.3
24.6
4.7
3.8
25.1
28.8
3.9
3.2
Cadila Healthcare
Accumulate
379
400
38,831
10,429
12,318
22.6
22.0
16.9
19.2
22.4
19.8
5.7
4.6
28.5
25.7
3.7
3.1
Cipla
Sell
582
490
46,828
15,378
18,089
17.4
18.4
21.6
27.2
27.0
21.4
3.5
3.0
13.7
15.2
3.2
2.7
Dr Reddy's
Neutral
3,161
-
52,360
16,043
18,119
20.8
22.4
112.4
142.9
28.1
22.1
3.8
3.3
14.1
15.9
3.2
2.8
Dishman Pharma
Neutral
228
-
3,678
1,718
1,890
22.7
22.8
9.5
11.3
24.0
20.2
2.3
2.1
10.1
10.9
2.6
2.3
GSK Pharma*
Neutral
2,715
-
23,001
3,000
3,312
15.4
20.6
46.5
60.8
58.4
44.7
14.0
14.0
26.3
30.6
7.4
6.8
Indoco Remedies
Reduce
272
240
2,507
1,112
1,289
16.2
18.2
11.6
16.0
23.5
17.0
3.8
3.2
17.0
20.1
2.4
2.0
Ipca labs
Accumulate
547
613
6,897
3,303
3,799
15.3
15.3
17.3
19.7
31.6
27.8
2.8
2.5
9.1
9.4
2.2
1.9
Lupin
Buy
1,512
1,809
68,271
15,912
18,644
26.4
26.7
58.1
69.3
26.0
21.8
5.1
4.2
21.4
20.9
4.4
3.6
Sun Pharma
Buy
641
847
153,777
31,129
35,258
32.0
32.9
30.2
35.3
21.2
18.2
3.5
2.9
20.0
20.1
4.5
3.8
Power
Tata Power
Neutral
77
-
20,853
36,916
39,557
17.4
27.1
5.1
6.3
15.1
12.2
1.3
1.2
9.0
10.3
1.6
1.4
NTPC
Neutral
164
-
135,143
86,605
95,545
17.5
20.8
11.8
13.4
13.9
12.2
1.4
1.3
10.5
11.1
2.9
2.9
Power Grid
Buy
189
223
98,746
25,315
29,193
88.2
88.7
14.2
17.2
13.3
11.0
2.0
1.8
15.2
16.1
8.5
7.7
Real Estate
Prestige Estate
Buy
172
210
6,467
4,707
5,105
25.2
26.0
10.3
13.0
16.7
13.3
1.3
1.3
10.3
10.2
2.5
2.2
MLIFE
Buy
357
522
1,464
1,152
1,300
22.7
24.6
29.9
35.8
11.9
10.0
0.9
0.8
7.6
8.6
2.0
1.7
Telecom
Bharti Airtel
Neutral
320
-
127,877
105,086
114,808
34.5
34.7
12.2
16.4
26.2
19.5
1.8
1.7
6.8
8.4
2.1
1.9
Idea Cellular
Neutral
73
-
26,254
40,133
43,731
37.2
37.1
6.4
6.5
11.4
11.2
1.0
0.9
8.2
7.6
1.7
1.4
zOthers
Abbott India
Neutral
4,599
-
9,773
3,153
3,583
14.1
14.4
152.2
182.7
30.2
25.2
148.4
126.7
25.6
26.1
2.8
2.4
Asian Granito
Buy
236
351
710
1,071
1,182
12.1
12.4
12.7
16.0
18.5
14.8
1.8
1.6
9.5
10.7
1.0
0.8
Bajaj Electricals
Buy
229
274
2,316
4,801
5,351
5.7
6.2
10.4
13.7
22.0
16.7
2.7
2.4
12.4
14.5
0.5
0.4
Banco Products (India)
Neutral
202
-
1,442
1,353
1,471
12.3
12.4
14.5
16.3
13.9
12.4
19.2
17.3
14.5
14.6
1.0
107.9
Coffee Day Enterprises
Neutral
197
-
4,053
2,964
3,260
20.5
21.2
4.7
8.0
-
24.6
2.3
2.1
5.5
8.5
1.8
1.6
Ltd
Competent Automobiles Neutral
163
-
100
1,137
1,256
3.1
2.7
28.0
23.6
5.8
6.9
31.4
28.3
14.3
11.5
0.1
0.1
Elecon Engineering
Neutral
57
-
643
1,482
1,660
13.7
14.5
3.9
5.8
14.7
9.9
3.5
3.2
7.8
10.9
0.8
0.7
Finolex Cables
Neutral
421
-
6,436
2,883
3,115
12.0
12.1
14.2
18.6
29.6
22.6
15.8
13.8
15.8
14.6
1.9
1.7
Garware Wall Ropes
Neutral
629
-
1,377
873
938
14.3
14.3
35.2
37.5
17.9
16.8
3.1
2.7
17.5
15.9
1.5
1.4
Goodyear India*
Neutral
721
-
1,664
1,598
1,704
10.4
10.2
49.4
52.6
14.6
13.7
67.4
59.1
18.2
17.0
0.7
101.0
Hitachi
Neutral
1,379
-
3,749
2,081
2,433
8.8
8.9
33.4
39.9
41.3
34.6
33.3
27.8
22.1
21.4
1.8
1.5
HSIL
Neutral
283
-
2,046
2,384
2,515
15.8
16.3
15.3
19.4
18.5
14.6
18.4
15.8
7.8
9.3
1.0
0.9
Stock Watch
January 09, 2017
Company Name
Reco
CMP
Target
Mkt Cap
Sales ( Čcr )
OPM(%)
EPS (Č)
PER(x)
P/BV(x)
RoE(%)
EV/Sales(x)
(Č)
Price ( Č)
( Č cr )
FY17E
FY18E
FY17E
FY18E
FY17E
FY18E
FY17E
FY18E
FY17E
FY18E
FY17E
FY18E
FY17E
FY18E
zOthers
Interglobe Aviation
Neutral
841
-
30,392
21,122
26,005
14.5
27.6
110.7
132.1
7.6
6.4
45.5
32.5
168.5
201.1
1.4
1.1
Jyothy Laboratories
Neutral
333
-
6,048
1,440
2,052
11.5
13.0
8.5
10.0
39.2
33.3
9.5
8.8
18.6
19.3
4.5
3.1
Kirloskar Engines India
Neutral
334
-
4,829
2,554
2,800
9.9
10.0
10.5
12.1
31.8
27.6
13.3
12.6
10.7
11.7
1.5
1.4
Ltd
Linc Pen & Plastics
Neutral
233
-
345
382
420
9.3
9.5
13.5
15.7
17.3
14.9
3.0
2.6
17.1
17.3
1.0
0.9
M M Forgings
Neutral
453
-
547
546
608
20.4
20.7
41.3
48.7
11.0
9.3
62.1
55.0
16.6
17.0
0.8
0.8
Manpasand Bever.
Neutral
538
-
3,076
836
1,087
19.6
19.4
16.9
23.8
31.8
22.6
3.8
3.3
12.0
14.8
3.4
2.5
Mirza International
Buy
93
107
1,116
987
1,106
18.0
18.0
6.5
7.6
14.2
12.2
2.3
1.9
15.9
15.7
1.3
1.2
MT Educare
Neutral
126
-
503
366
417
17.7
18.2
9.4
10.8
13.5
11.7
3.0
2.6
22.2
22.3
1.3
1.1
Narayana Hrudaya
Neutral
340
-
6,941
1,873
2,166
11.5
11.7
2.6
4.0
128.4
85.7
7.9
7.1
6.1
8.3
3.8
3.3
Navkar Corporation
Buy
173
265
2,471
369
561
42.9
42.3
7.2
11.5
24.0
15.1
1.8
1.6
7.4
10.5
7.7
5.1
Navneet Education
Neutral
124
-
2,954
1,062
1,147
24.0
24.0
6.1
6.6
20.4
18.7
4.2
3.7
20.6
19.8
2.9
2.6
Nilkamal
Neutral
1,401
-
2,090
1,995
2,165
10.7
10.4
69.8
80.6
20.1
17.4
80.0
69.5
16.6
16.5
1.0
0.9
Page Industries
Neutral
13,700
-
15,281
2,450
3,124
20.1
17.6
299.0
310.0
45.8
44.2
305.1
232.9
47.1
87.5
6.3
5.0
Parag Milk Foods
Neutral
263
-
2,211
1,919
2,231
9.3
9.6
9.5
12.9
27.8
20.3
4.3
3.6
15.5
17.5
1.3
1.1
Quick Heal
Neutral
256
-
1,796
408
495
27.3
27.0
7.7
8.8
33.1
29.2
3.1
3.1
9.3
10.6
3.5
2.9
Radico Khaitan
Buy
121
147
1,614
1,667
1,824
13.0
13.2
6.7
8.2
18.2
14.8
1.7
1.5
9.0
10.2
1.4
1.2
Relaxo Footwears
Neutral
402
-
4,829
2,085
2,469
9.2
8.2
7.6
8.0
53.2
50.6
20.6
17.6
17.9
18.8
2.4
2.1
S H Kelkar & Co.
Neutral
318
-
4,593
1,036
1,160
15.1
15.0
6.1
7.2
52.0
44.3
5.6
5.1
10.7
11.5
4.3
3.8
Siyaram Silk Mills
Accumulate
1,374
1,605
1,288
1,733
1,948
11.6
11.7
96.6
114.7
14.2
12.0
2.2
1.9
15.3
15.7
0.9
0.8
Styrolution ABS India*
Neutral
602
-
1,059
1,440
1,537
9.2
9.0
40.6
42.6
14.8
14.1
37.9
34.4
12.3
11.6
0.7
0.6
Surya Roshni
Neutral
185
-
812
3,342
3,625
7.8
7.5
17.3
19.8
10.7
9.4
20.4
16.3
10.5
10.8
0.5
0.5
Team Lease Serv.
Neutral
903
-
1,544
3,229
4,001
1.5
1.8
22.8
32.8
39.7
27.5
4.3
3.7
10.7
13.4
0.4
0.3
The Byke Hospitality
Neutral
172
-
690
287
384
20.5
20.5
7.6
10.7
22.7
16.1
4.7
3.8
20.7
23.5
2.4
1.8
Transport Corporation of
Neutral
153
-
1,173
2,671
2,911
8.5
8.8
13.9
15.7
11.1
9.8
1.5
1.4
13.7
13.8
0.5
0.5
India
TVS Srichakra
Neutral
3,239
-
2,480
2,304
2,614
13.7
13.8
231.1
266.6
14.0
12.2
364.0
286.6
33.9
29.3
1.1
0.9
UFO Moviez
Neutral
416
-
1,147
619
685
33.2
33.4
30.0
34.9
13.9
11.9
1.9
1.7
13.8
13.9
1.6
1.2
Visaka Industries
Neutral
190
-
302
1,051
1,138
10.3
10.4
21.0
23.1
9.1
8.2
24.4
22.8
9.0
9.2
0.5
0.5
VRL Logistics
Neutral
271
-
2,476
1,902
2,119
16.7
16.6
14.6
16.8
18.6
16.1
4.1
3.6
21.9
22.2
1.4
1.2
Wonderla Holidays
Neutral
344
-
1,944
287
355
38.0
40.0
11.3
14.2
30.5
24.2
4.4
3.8
21.4
23.9
6.5
5.2
Source: Company, Angel Research; Note: *December year end; #September year end; &October year end; Price as on January 06, 2017
Market Outlook
January 09, 2017
Research Team Tel: 022 - 39357800
DISCLAIMER
Angel Broking Private Limited (hereinafter referred to as “Angel”) is a registered Member of National Stock Exchange of India
Limited,Bombay Stock Exchange Limited and Metropolitan Stock Exchange Limited. It is also registered as a Depository Participant with
CDSL and Portfolio Manager with SEBI. It also has registration with AMFI as a Mutual Fund Distributor. Angel Broking Private Limited is a
registered entity with SEBI for Research Analyst in terms of SEBI (Research Analyst) Regulations, 2014 vide registration number
INH000000164. Angel or its associates has not been debarred/ suspended by SEBI or any other regulatory authority for accessing
/dealing in securities Market. Angel or its associates/analyst has not received any compensation / managed or
co-managed public offering of securities of the company covered by Analyst during the past twelve months.
This document is solely for the personal information of the recipient, and must not be singularly used as the basis of any investment
decision. Nothing in this document should be construed as investment or financial advice. Each recipient of this document should make
such investigations as they deem necessary to arrive at an independent evaluation of an investment in the securities of the companies
referred to in this document (including the merits and risks involved), and should consult their own advisors to determine the merits and
risks of such an investment.
Reports based on technical and derivative analysis center on studying charts of a stock's price movement, outstanding positions and
trading volume, as opposed to focusing on a company's fundamentals and, as such, may not match with a report on a company's
fundamentals. Investors are advised to refer the Fundamental and Technical Research Reports available on our website to evaluate the
contrary view, if any.
The information in this document has been printed on the basis of publicly available information, internal data and other reliable
sources believed to be true, but we do not represent that it is accurate or complete and it should not be relied on as such, as this
document is for general guidance only. Angel Broking Pvt. Limited or any of its affiliates/ group companies shall not be in any way
responsible for any loss or damage that may arise to any person from any inadvertent error in the information contained in this report.
Angel Broking Pvt. Limited has not independently verified all the information contained within this document. Accordingly, we cannot
testify, nor make any representation or warranty, express or implied, to the accuracy, contents or data contained within this document.
While Angel Broking Pvt. Limited endeavors to update on a reasonable basis the information discussed in this material, there may be
regulatory, compliance, or other reasons that prevent us from doing so.
This document is being supplied to you solely for your information, and its contents, information or data may not be reproduced,
redistributed or passed on, directly or indirectly.
Neither Angel Broking Pvt. Limited, nor its directors, employees or affiliates shall be liable for any loss or damage that may arise from
or in connection with the use of this information.